🏷️ The Planogram: When Shelves Learned to Think
From gut feel to gridlines, retailers turned shelf space into strategy - measured in inches, facings, and now, pixels.

Walk any aisle and you’re seeing a map - just not the paper kind. Every brand at eye-level, every flavor tucked near its complement, every gap watched like a hawk. That map is the planogram: a quiet blueprint that turned shelf space into strategy, and browsing into a designed journey. What began as clipboards and tape measures now lives in algorithms and digital twins - shaping what we see, pick up, and buy.


🗺️ Where Did It Begin?
Mid-20th-century grocers started asking a simple question with big implications: Which products sell more when we move them? Early “space elasticity” studies, end-cap experiments, and paper diagrams hinted that inches matter. The arrival of the UPC (1970s) and electronic scanners unlocked hard proof, and by the 1980s, category managers drafted shelves like engineers - gridding every facing to forecast sales.
A surprising detail: Before software, teams used colored tape, cardboard cutouts, and Polaroids to simulate shelves - re-staging entire bays overnight to test tomorrow’s “map.”
💡 Why Did It Matter?
First, placement is persuasion. Shoppers don’t read every label; they follow sightlines, reach zones, and habits. Planograms turned that psychology into policy. Second, space is finite. Data-driven layouts squeeze more revenue from the same square feet. Third, consistency matters - national chains needed repeatable experiences across hundreds of stores.
Persuasion → performance: Eye-level, adjacencies, and end-caps lift conversion without cutting price.
Space productivity: Right facings reduce stockouts and clutter; wrong ones waste inches and margin.
Brand & trust: Consistent placement builds shopper memory - and faster trips.
🔄 How Did It Evolve?
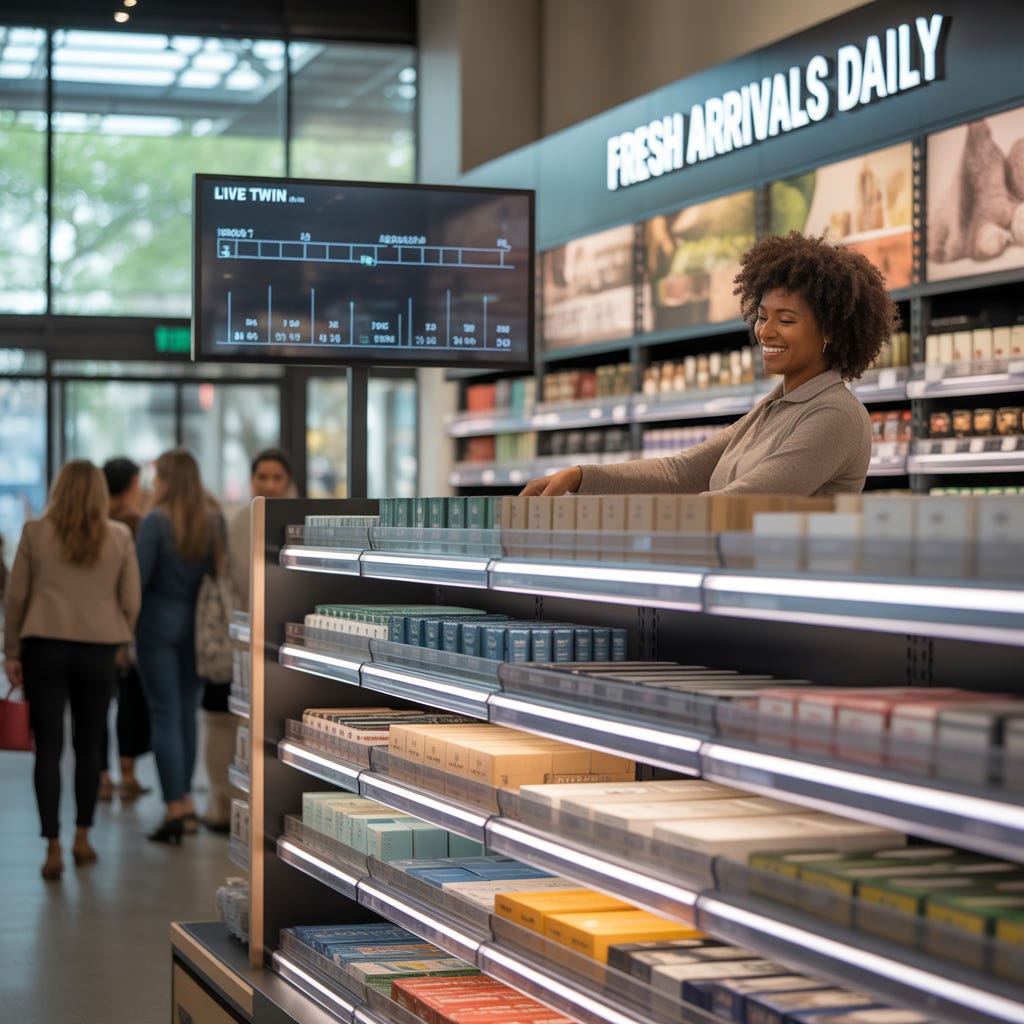
By the 1990s, category management and early planogram software formalized “the right product, right place, right time.” Scanner data (Nielsen/IRI) fed rules; retailers tested adjacencies (pasta next to sauce; chips near salsa) and “eye-level is buy-level.” The 2000s layered on localization and tiered sets for different store sizes. Today, computer vision, shelf-scanning robots, and mobile audits check real-time compliance, while digital shelf labels and price APIs enable on-the-fly tweaks.
1980s–90s: Software plans sets; category management takes hold.
2000s: Clustered planograms by store format, neighborhood, and missions.
2010s–Now: Computer vision, heat maps, ESLs, and rapid A/B tests; online grids mirror shelf logic.
🌟 The Echo Today
Planograms no longer stop at the aisle. E-commerce category pages, search results, and recommendation zones are planograms in pixels - eye-level becomes “above the fold.” Omnichannel adds new surfaces: pickup shelves, staging areas, and micro-fulfillment lanes require their own maps. The best retailers blend shopper-first principles with vendor funding - balancing slotting fees against clarity and trust.
Omni mapping: Store shelves, apps, and pickup zones share one logic.
Shopper-first design: Clear adjacencies, inclusive reach heights, and fewer “treasure hunts.”
Live feedback: Returns, dwell, and out-of-stocks retrain next week’s set.
Ethics & optics: Monetize space - without confusing the customer.
🕊️ What’s the Lesson?
Presentation is policy. When every inch and pixel has a job, shelves stop being storage and start telling a story. Build maps that respect how people actually shop—and the aisle will do more of the selling for you.
🕰️ Echoes of Commerce